Written by Tyler Wolfe
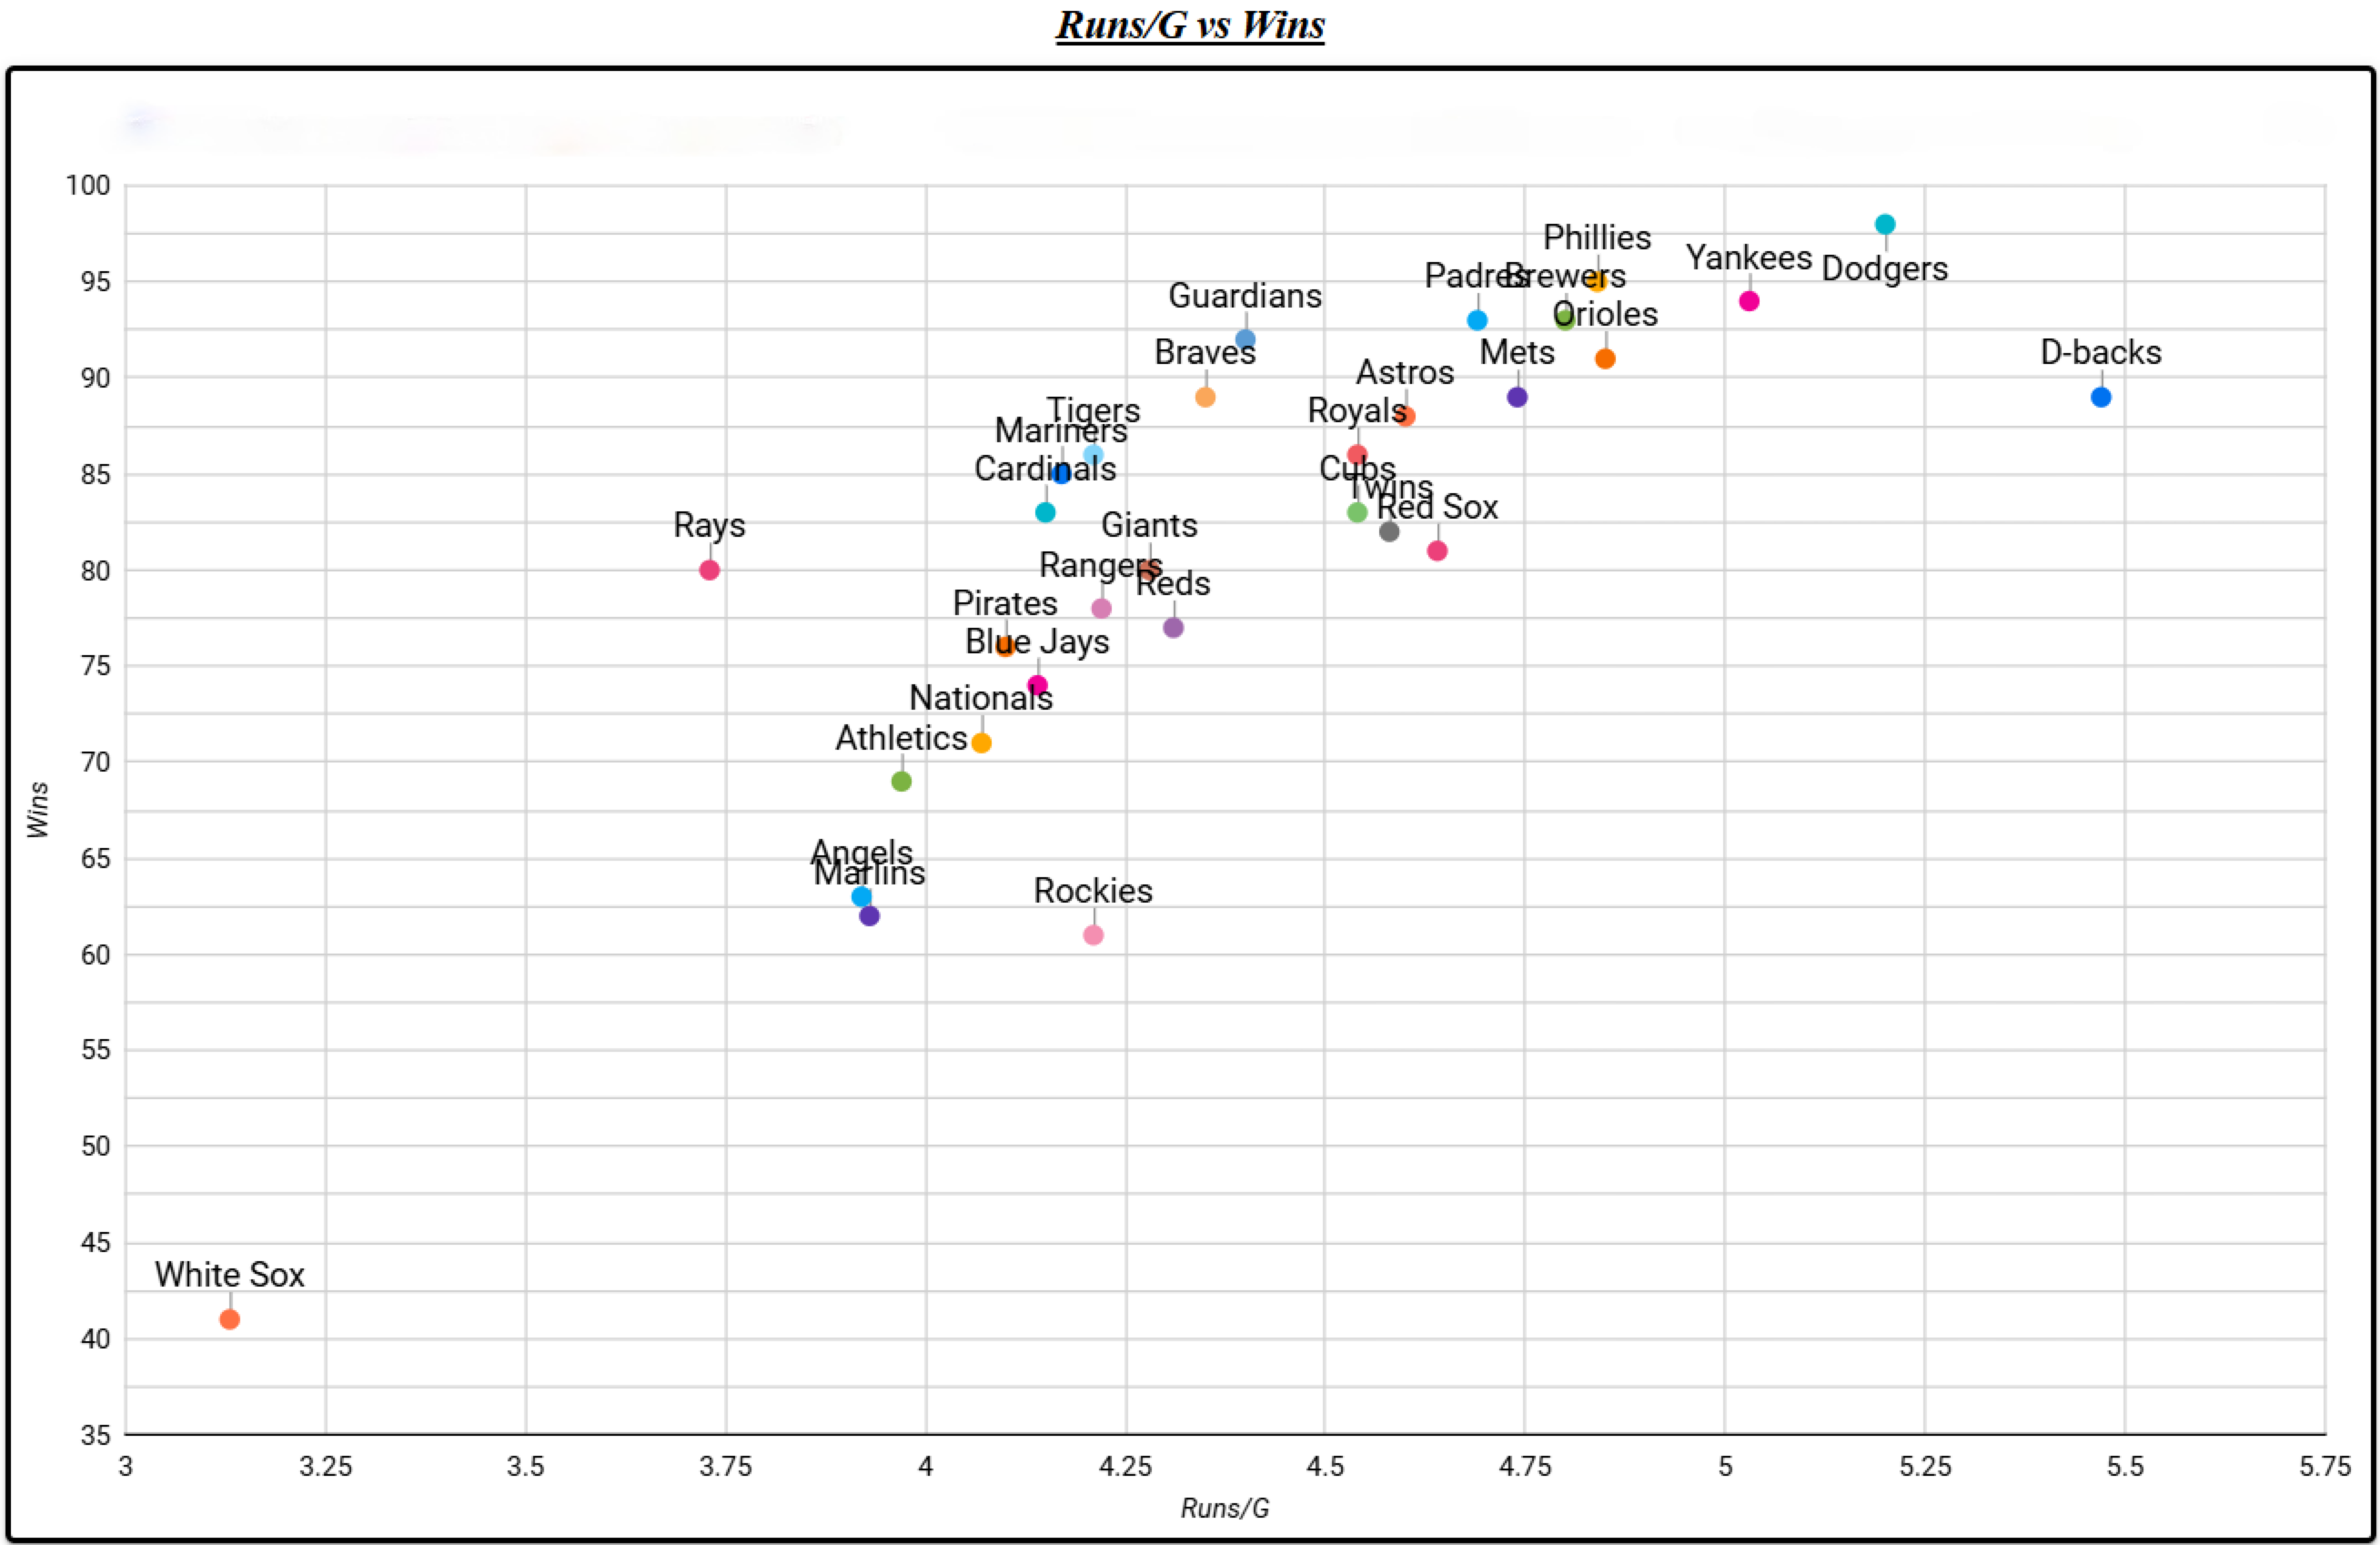
As an offense, the ultimate goal is to score more runs than the other team. In my opinion, this is what makes runs per game one of the best stats for assessing an offense as a whole over the course of a season. When examining the relationship between team wins and runs per game in MLB for 2024, a clear pattern emerges. The correlation coefficient is 0.814, indicating a strong positive relationship—teams that score more runs per game tend to win more games. The R-squared value is 0.662, which means that approximately 66.2% of the variation in team wins can be explained by differences in runs per game. Of course scoring runs is only half of the game but this highlights the important role that offensive production plays in a team’s overall success.
Since I already had the data from my previous blog on Vertical Bat Angle (VBA), I wanted to sort through the data from a team perspective and see if there was anything that stood out when it came to scoring runs based upon those same stats from the 2024 season. I found some interesting things that challenged my beliefs, as well as some obvious outcomes as well.
Why we don’t use batting average to evaluate a hitter anymore:
Before we dive into the data, I wanted to go through and show why baseball stats have evolved over the years because there is such bad animosity between different generations in the baseball world these days. In my almost 10 years now in professional baseball I have played with or worked with players from every professional organization and many colleges, so I have been able to see what nearly every organization uses to evaluate their players. There is a reason why our tools for evaluating hitters have continued to adapt and why analytics do play a significant role in the game today. I want to try to help everyone understand why we often see some of the current stats to evaluate hitters. Nobody is saying that batting average is not a good stat because it is still very relevant, there just happen to be stats that correlate much better to scoring runs. Two of the stats we usually see now that are used across the board, and as you saw in my VBA study to evaluate hitters, are OPS and wOBA.
Here’s a closer look at a few different stats so everyone has an idea of each using charts below:
- The first chart shows the relationship between batting average and runs per game. Batting average has a correlation of 0.804 and an R-squared value of 0.691. This means that while there is a strong positive relationship between batting average and runs per game, about 69.1% of the variation in runs per game can be explained by batting average alone.
- However, as baseball advanced into the “Moneyball Era,” a shift occurred in the way players were evaluated. On-Base Percentage (OBP) emerged as a key statistic because it more effectively captured a player’s ability to reach base, which of course is crucial for generating runs. In the second chart, we see OBP with a correlation of 0.930 and an R-squared value of 0.865, demonstrating that OBP is even more predictive of runs per game than batting average.
- Following the Moneyball Era, the focus the last few years has now shifted further to advanced statistics like OPS (On-Base Plus Slugging) and wOBA (Weighted On-Base Average). These stats account for more valuable offensive outcomes such as home runs and extra-base hits, which batting average does not fully reflect. From my data, wOBA (chart 3) has a correlation of 0.961 and an R-squared value of 0.924 with runs per game, while OPS (chart 4) shows a nearly identical correlation of 0.958 and an R-squared value of 0.919. These values demonstrate that OPS and wOBA are much stronger predictors of a player’s ability to contribute to run-scoring compared to batting average. A real world example of this, given to me by a fellow coach Warren ‘Buddy’ Fultz who always continues to help me challenge my knowledge and beliefs was: ‘Think of Batting Average to photography what a fancy camera is—it’s helpful, but metrics like OPS/wOBA are like mastering great photography techniques to go with said camera; they correlate far better with the final outcome.’
While batting average is still a relevant statistic, its lower correlation and R-squared values compared to OPS and wOBA highlight why these newer metrics have become the go-to tools for evaluating hitters in today’s game. (And yes, there are currently even more advanced statistics and I can promise you there will continue to be new stats that are even more encompassing of a players value in the future). I wrote this part into this article so that everyone understands why, in my last blog on VBA, I used the stats I did to evaluate VBA differences.
So now that we’re hopefully all on the same page let’s get into what the same research said on runs per game. Here’s a few of the things I looked into: contact & zone management, as well as success against different pitch types & pitch locations.
Strikeout Rate & Walk Rate
Let’s begin by examining the relationships between two key metrics: Strikeout Rate (K%) and Walk Rate (BB%) versus runs per game. The strikeout rate (K%) has a negative correlation of -0.424 with runs per game, indicating a moderate inverse relationship—higher strikeout rates are associated with fewer runs scored. Additionally, its R-squared value is 0.180, meaning that differences in strikeout rates explain 18% of the variation in runs scored.
In contrast, the walk rate (BB%) shows a positive correlation of 0.558 with runs per game, suggesting a moderate to strong direct relationship—higher walk rates are linked to more runs scored. The R-squared value for walk rate is 0.311, indicating that differences in walk rates account for 31% of the variation in runs scored.
So, in summary, both K% and BB% have some relationship with runs scored, but neither metric is a strong predictor of runs per game on its own, especially when looking at the relatively low R-squared values. This means other factors likely play a more significant role determining a team’s runs per game. (Chart below represents a visual for these two. Teams are ranked in order of average runs per game from highest on the left to lowest on the right along the x-axis).
- Since I mentioned this in my previous VBA blog, I did want to highlight it here: A higher Miss% leads to a higher K%, and a higher Chase% is associated with a lower BB%. Here’s the data on how these metrics compare:
- K% (First chart below): IZ-Miss% has a strong positive correlation of 0.898 and an R-squared value of 0.807, this means that it explains 81% of the variation in K%. On the other hand, Chase% shows a minimal correlation of -0.014, with an R-squared value of 0.000, which means it has almost no relationship with K%.
- BB% (Second chart below): IZ-Miss% has a slight positive correlation of 0.082, with an R-squared value of 0.007, suggesting it has virtually no impact on BB%. However, Chase% demonstrates a strong negative correlation of -0.842, with an R-squared value of 0.709, meaning it explains 71% of the variation in BB%.
Sorry if this hurt anyone’s beliefs when looking at these. Especially how K% doesn’t seem to matter as much as we may want it to when it comes to predicting runs per game. Again, I’m talking about scoring runs as a whole throughout the entirety of a season, not in each individual situation. As I mentioned in the last article, there are times where a strikeout definitely hurts scoring a run. Ex: Runner on 3rd, infield back, 1 out. A strikeout could be more damaging in this situation than most other outcomes and could help produce a run, but this is one of just a few situations. This next part might help get us back to our beliefs though: Success against fastballs plays the most significant role in determining runs per game than success against other pitch types.
wOBA vs Specific Pitch Types:
Let’s break this down by examining wOBA against different pitch types (Fastballs, Sinkers, and All Off-Speed pitches) and comparing them to runs per game:
Fastballs:
- Correlation: 0.854
- R-squared: 0.729
A correlation of 0.854 is considered strong, which suggests that teams who perform better against fastballs tend to score more runs. The R-squared value of 0.729 means that 73% of the variation in runs per game can be explained by a team’s ability to hit fastballs. In other words, a team’s success against fastballs is a significant predictor of how many runs they score on average.
Off-Speed Pitches (All Types):
- Correlation: 0.714
- R-squared: 0.509
- The correlation of 0.714 is also strong, indicating that teams that perform well against off-speed pitches (changeups, splitters, etc.) tend to score more runs.The R-squared value of 0.509 shows that 50.9% of the variation in runs per game can be explained by performance against off-speed pitches. While this is a notable contribution, it’s still slightly less predictive than performance against fastballs.
Sinkers:
- Correlation: 0.601
- R-squared: 0.361
The correlation of 0.601 is moderate, indicating a positive but weaker relationship between wOBA against sinkers and runs per game. Teams that hit sinkers better tend to score more runs, but the relationship isn’t as strong as it is with fastballs. The R-squared value of 0.361 means that only 36% of the variation in runs can be explained by performance against sinkers. While it has some predictive power, there are other factors at play in determining runs scored.
Fastballs have the strongest correlation and R-squared value, meaning success against fastballs is the most significant factor in predicting a team’s runs per game. Off-speed pitches also have strong positive correlations with runs, suggesting that hitting these pitches well is another important factor. Sinkers, while still positively correlated with runs, have a weaker correlation and explain less of the variation in runs per game compared to the other pitch types (Likely due to fewer sinkers being thrown today than in previous seasons/decades- only 15.2% of all pitches thrown in 2024 according to baseball Savant).
In conclusion, when looking at success against pitch types, a team’s ability to hit fastballs stands out as the most important factor in determining runs scored, followed by performance against off-speed pitches. As we’ve always heard throughout baseball history, you have to be able to handle the fastball if you want to be successful and move up in this game.
wOBA by Zone Location and their correlation to Runs/G
Let’s examine the wOBA for different pitch locations in 2024 and how they correlate with runs per game:
- Outer Half wOBA has the highest correlation of 0.925 with runs per game and an R-squared value of 0.855, explaining 85.5% of the variation in runs scored.
- Lower Half wOBA has a correlation of 0.878 and an R-squared value of 0.771, explaining 77.1% of the variation in runs.
- Upper Half wOBA has a correlation of 0.847 with runs per game and an R-squared value of 0.718, meaning it explains 71.8% of the variation in runs.
- Inner Half wOBA shows a correlation of 0.794 and an R-squared value of 0.631, indicating it explains 63.1% of the variation in runs.
Now, let’s break this down further by looking at specific pitches in these locations:
- Upper Half Fastballs wOBA has a correlation of 0.796 with runs per game and an R-squared value of 0.634, explaining 63.4% of the variation in runs.
- Lower Half Fastballs wOBA shows a much weaker correlation of 0.496 and an R-squared value of 0.246, explaining only 24.6% of the variation in runs.
- Upper Half Sinkers wOBA has a very low correlation of 0.156, with an R-squared value of 0.024, meaning it explains only 2.4% of the variation in runs.
- Lower Half Sinkers wOBA shows a stronger correlation of 0.690, with an R-squared value of 0.476, explaining 47.6% of the variation in runs.
- Upper Half Off-Speed wOBA has a correlation of 0.436 and an R-squared value of 0.190, explaining only 19% of the variation in runs.
- Lower Half Off-Speed wOBA has a stronger correlation of 0.754 with an R-squared value of 0.569, explaining 56.9% of the variation in runs.
Some very interesting takeaways and my thoughts on why:
- Outer Half of the plate shows the strongest relationship with runs scored, with the highest correlation and R-squared values. Likely because the majority of pitches thrown are on the middle to outer half. Pitching inside is not the easiest thing to do and it’s always more comfortable to live on the outer part of the plate to hitters. This is my guess as to why we see this being the strongest correlated pitch location. (Although I never did look up middle middle and that is likely the best).
- Lower Half wOBA also has a strong correlation with runs scored, especially for sinkers and off-speed pitches. Once again, most of the sinkers and off-speed tend to be in this location so the majority of the swings against will be here as well.
- Upper Half wOBA shows a relatively strong correlation, but specific pitch types in these locations, like upper half fastballs, show more variation.
- Sinkers and off-speed pitches in the upper half have the weakest correlations with runs, meaning performance in these areas doesn’t explain much of the variation in scoring. This is the one that really challenged my beliefs on hitting. What about hammering the breaking balls and sinkers up in the zone that we preach to hitters to do? This is very likely explained by there being less swings on those specific pitches in those locations, but even so, it is still surprising that these pitches in the upper half or the zone aren’t more relevant when sorting through the data. Especially with our belief that these are the pitches we expect the highest damage swings to come on.
This breakdown suggests that certain locations and pitch types are more predictive of runs than others, with the outer half and lower half locations being more significant in determining scoring potential. An interesting thought when you circle back to the VBA research. This gives a good foundation for utilizing the very general approach of being ready for the FB slightly elevated in the zone (the fastest pitch and one you have to be earliest on) and then adjust to anything off of that.
Once again, I hope you got something out of this because I know I sure did when going through the research. Remember, this data only represents what pitches/locations were in play when runs were scored. So of course the pitches away and the pitches down will show up more and have a higher correlation because there is likely a much greater sample size there than on pitches up and closer to a hitter that are put in play. But at the same time, which pitch is likely easier to do more damage on? Usually the one up and closer. This just shows me that being able to hit different pitch speeds, pitch movements, and pitch locations are all very valuable to being a good hitter. If you can’t cover everything, be so stubborn to what/where you do well when in the box. (Ex – go look at new $765 million dollar man Juan Soto’s heat maps of his swing rates vs his in play success and tell me he’s not stubborn to a certain location – He’s a very flat VBA hitter who struggles down in the zone).
Don’t forget, don’t use this as an end all be all when coaching hitters or looking at an offense. We have to build an offense as a whole with many different pieces. Find out how each hitter fits and how to get the most value out of each hitter with what they can do. That is the beauty of coaching, helping each individual be as productive as they can be with what skills they have.
Last Note: One player may be valuable in very different way to different teams.
Before I end, one more thing I looked into was ballpark factors, since they can have a significant impact on how a ball travels, and teams play half of their games in their own stadium. To explore this, I compared the rankings of ballparks based on their impact on runs scored (as provided by Baseball Savant) with the actual runs per game for teams. The results showed no meaningful relationship between the two. This is reflected in the R-squared value of just 0.012, which suggests that ballpark factors have almost no influence on runs scored (Scatter plot below).
Happy hitting/coaching!


