One of the biggest debates in the hitting world, across generations, is whether hitters should swing up or down. Both sides have strong beliefs about why they’re right… and maybe they both are. In my opinion, what they’re really arguing about is the Attack Angle (AA) of the swing. In this blog, I’ll dive into AA and explore the trends we see with different angles.
Before we jump in, a quick reminder: there’s always a difference between “feel” and “real” in the baseball swing. What a hitter feels they’re doing often doesn’t match what’s actually happening. For example, a player might swear they’re swinging down, when video and data show they’re still swinging slightly up, just less than before (think A-Rod vs. Donaldson).
One last note: every swing has its own AA. Contact point, pitch location, and pitch height all change the angle. The baseball swing is one of the most complex and adaptive movements in all of sports, no two swings and no two pitches are ever the same. The data I’ll show here focuses on average AA per hitter, which helps us see patterns without losing sight of that variability.
What is Attack Angle?
Over the past few years, Vertical Bat Angle (VBA) has become a hot topic in the hitting world — and rightfully so, since the data helps us evaluate hitters and design development plans (see my blog on VBA here: VBA 2.0). But remember, VBA is just a single 3D snapshot at contact.
Attack Angle (AA) gives us a fuller picture. It’s also a 3D measurement, but instead of one frame, it tracks the bat’s path through contact over time. In short, it shows how the barrel is moving, not just where it is at the instant of contact.
Here’s the basic definition:
- AA = the angle of the barrel’s path relative to the ground.
- Zero: Barrel is parallel to the ground through contact.
- Negative: Barrel is moving downward.
- Positive: Barrel is moving upward.
(For a deeper dive, Driveline has a great article on AA.)
Most studies, including Blast Motion’s, suggest the optimal AA range is 5–15° (I’ll dig into this more later). For example, in the attack angle back view video below, three swings have almost identical VBA’s but very different AA’s. Notice how the average AA for each hitter changes the outcome.
I like these examples because they show how AA interacts with the out front contact point:
- Low AA → often higher infield popup rates (downward path clips under the ball).
- High AA → often more topspin chopped ground balls (barrel catches top of the ball).
- Deeper contact → the results flip: steeper AA’s produce more groundballs, while higher AA’s may lead to more popups.
Here are two side-view clips: the left shows a negative AA, the middle an average AA, and the right a well-above-average AA in both videos.
With that foundation set, let’s dive into the research. For my dataset, I used >50 swings (Baseball Savant) for bat path data and >100 ABs (FanGraphs) for batted-ball performance data.
AA vs VBA
The first relationship I examined was between AA and VBA, mainly to check if I was just repeating my VBA research. The correlation came out to 0.33, which is weak but still positive. In other words, a steeper VBA (around -35 to -40 degrees) doesn’t necessarily mean a hitter will have a higher AA.
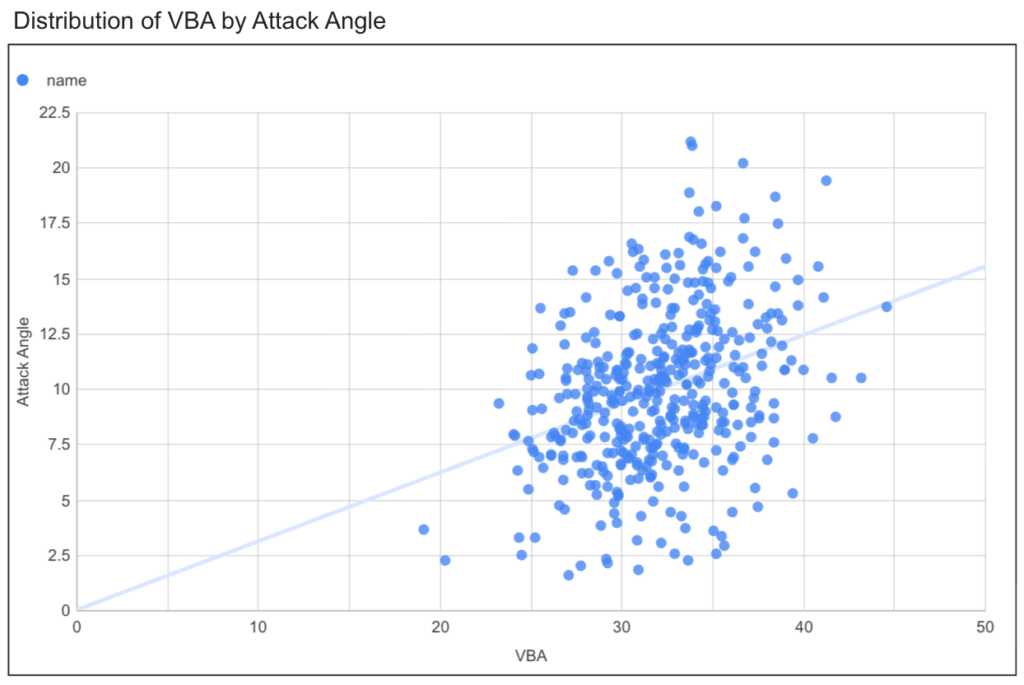
To me, this highlights that AA and VBA aren’t directly linked. There’s clearly more influencing AA than just the bat’s movement at contact, factors like timing and contact point play a major role. Unlike VBA, which is a single snapshot, AA unfolds over time and space, so more variables naturally come into play.
With that established, let’s move on to the more interesting findings, starting with one of the most important aspects of hitting: contact.
Contact Rate
I found a -0.46 correlation between Contact% and AA, a moderate negative relationship. In other words, the flatter the AA (closer to 0), the more likely a hitter is to make contact. This includes both balls in play and foul balls.

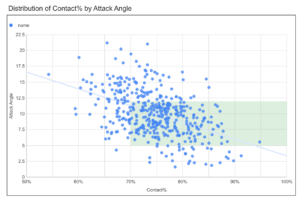
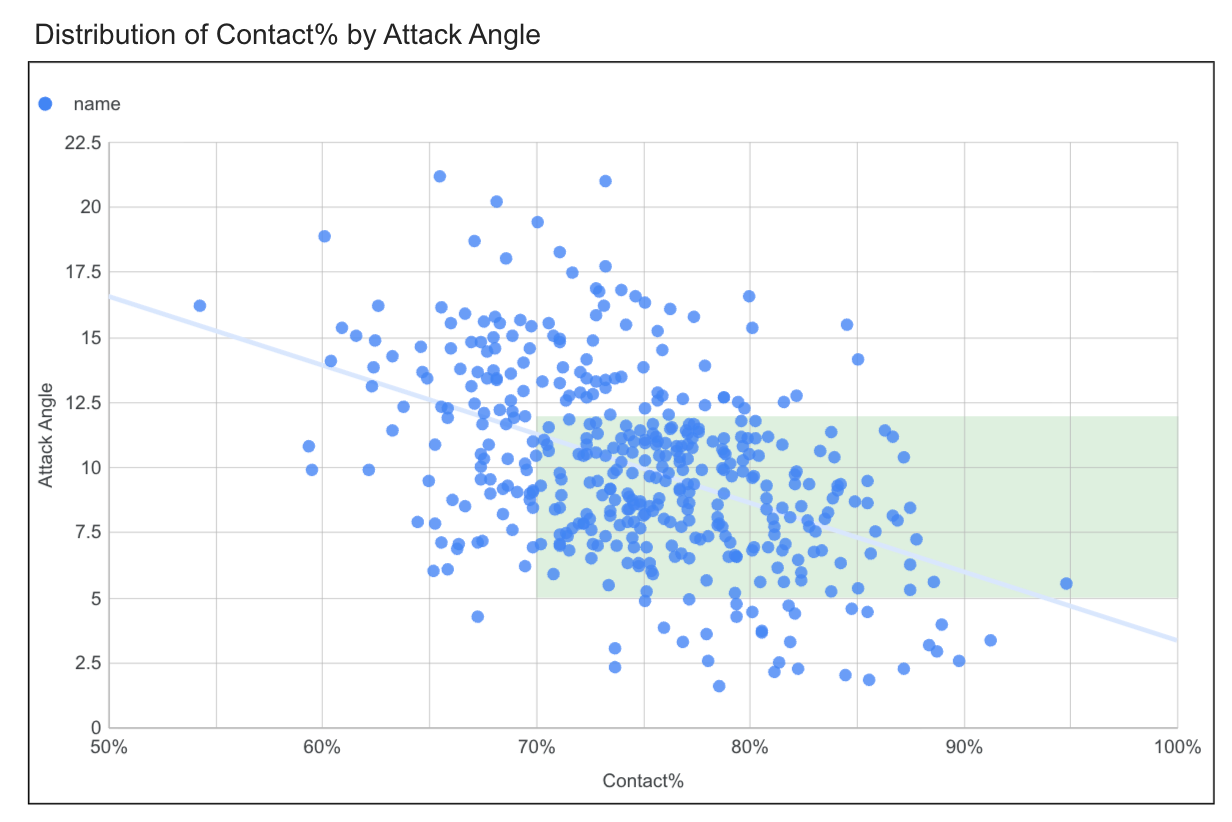
Why does this make sense? It comes back to the Vertical Approach Angle (VAA) of pitches. The average fastball enters the zone at about -5 degrees, so a swing with a positive 5-degree AA would match it closely. Most pitches fall within a -3 to -12 degree VAA range, which aligns well with the 3 to 12 degree AA window we see in the chart below.
For context:
- Bryan Woo and Craig Kimbrel’s fastballs at the top of the zone average around -3.1 VAA (among the flattest).
- Clayton Kershaw’s curveball at the bottom of the zone averages around -12.3 VAA (among the steepest).
- A few sidearmers get down to -2 VAA, but for most pitchers, -3 is about as flat as it gets.
So, if making more contact is the goal, flattening a hitter’s AA slightly is often a great starting point. It’s no surprise that most big leaguers sit in the 5–15 degree AA range, which aligns with the VAA of the majority of pitches they face.
Of course, contact isn’t just about the swing path, timing and hand–eye coordination are the biggest variables. Still, this research shows that if a player struggles to make contact, monitoring and adjusting their AA can be a useful lever. That said, simply putting the ball in play isn’t the end goal. Hitters need enough contact to compete, but the quality and production of that contact is what ultimately matters.
Everybody’s favorite term: Launch Angle
I don’t love talking about it, but every batted ball has one, we can’t deny that. What matters more is how different launch angles translate into production. Research consistently shows that line drives (LD’s) are the most productive batted ball type because of their flatter trajectory and shorter hang time. Some studies even break LD’s into smaller buckets. One good example is Leo Morgenstern’s Fangraghs: Where Do We Draw the Line Drive which dives deeper into those distinctions.
For my research, I kept it simple with the average parameters used:
- Groundballs (GB’s): under 10°
- Line drives (LD’s): 10–25°
- Flyballs (FB’s): 25–50°
Here’s what I found:
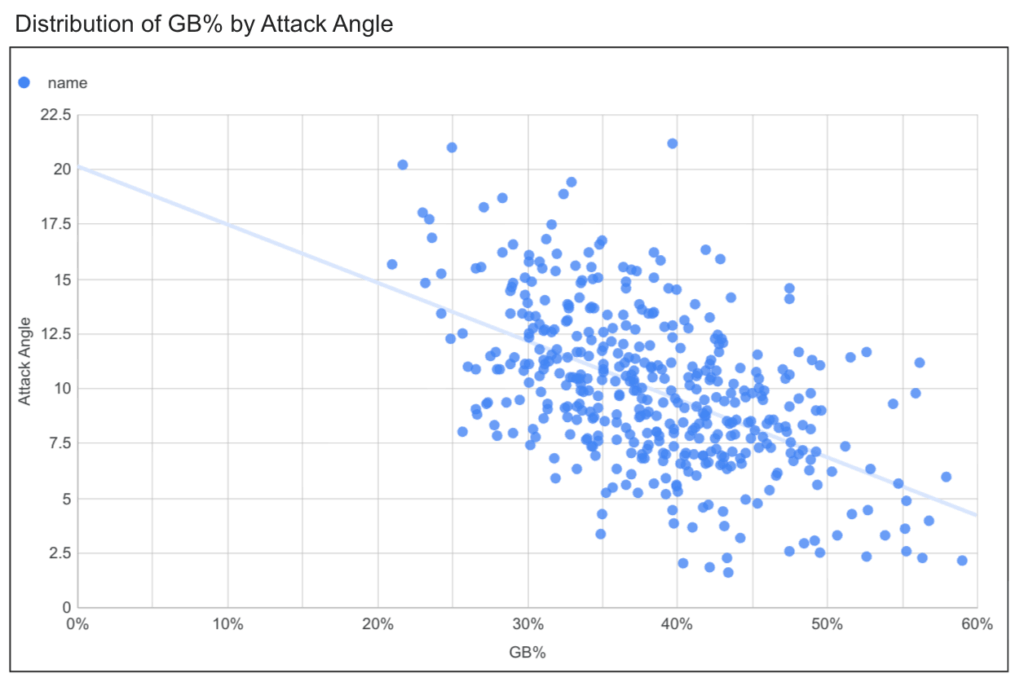
- GB% vs. AA: -0.51 correlation (moderate negative). The flatter the AA, the more groundballs a hitter produces.
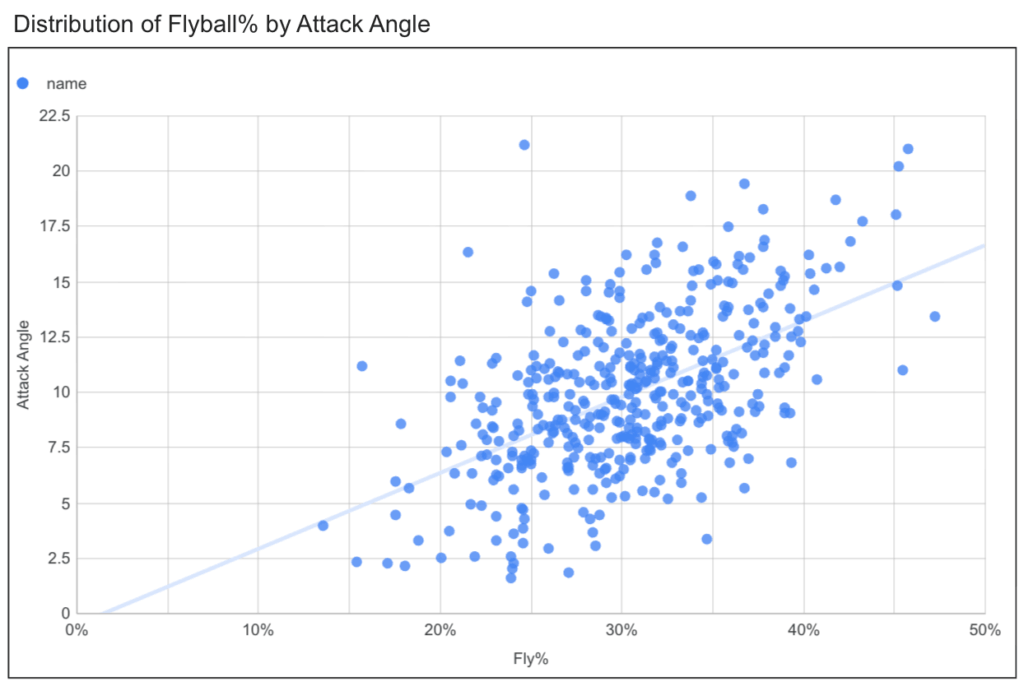
- FB% vs. AA: 0.55 correlation (moderate positive). The more uphill the AA, the more flyballs a hitter produces
- LD% vs. AA: -0.05 correlation (no real connection). All AA ranges produced line drives at about the same rate.
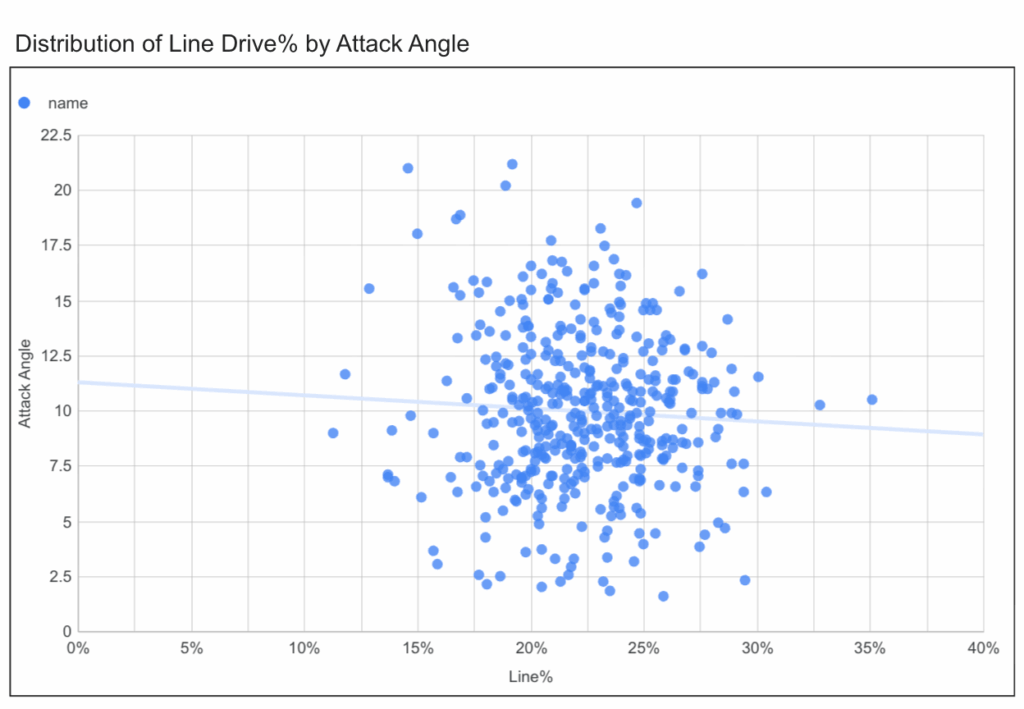
This last point makes sense. Timing, contact point, and hand–eye coordination are bigger factors in producing LD’s than the swing path itself. If you go back to the earlier GIF’s of different paths, you can see that each one crosses the plane of the pitch at some point—providing a window for line-drive contact regardless of AA.
Future research could explore the type of line drives created by different AA’s:
- Steeper/downhill AA’s → more backspin.
- Average AA’s → low-spin, almost knuckleball-like.
- Higher AA’s → more topspin.
None of these is inherently bad, each can produce hits in different ways. That’s why evaluating a hitter means understanding their current batted-ball profile. Some thrive with a higher flyball rate; others are at their best when they keep the ball too high out of the air. Once we know their average AA and outcomes, we can decide whether to adjust their path or leave it as is.
Launch angles are only one part of the equation. Next, let’s look at another key factor: spray angles.
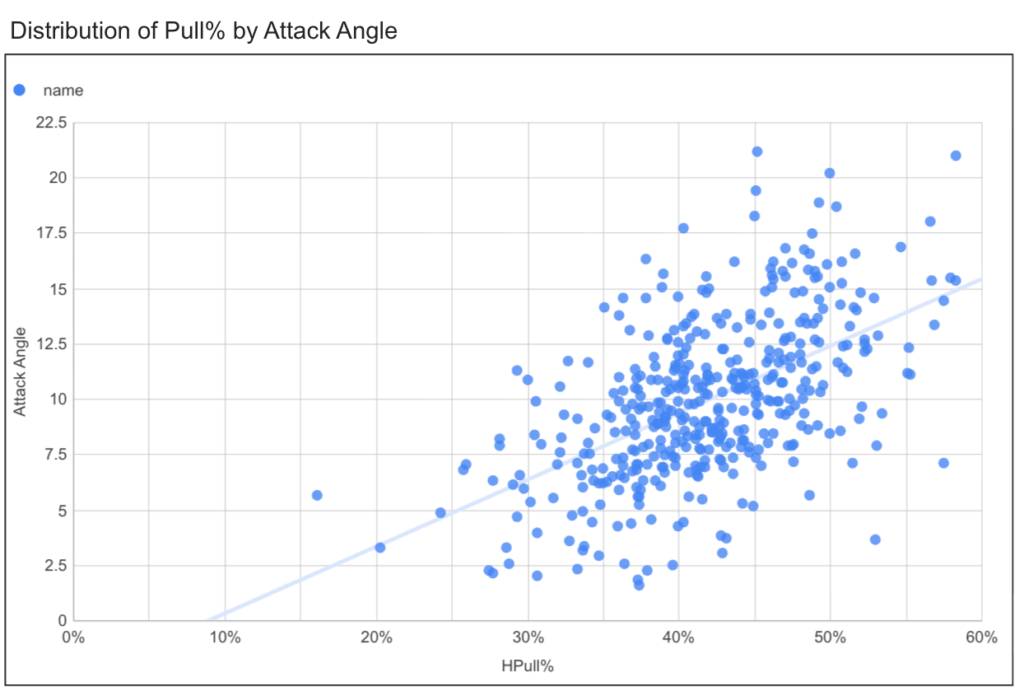
Batted Ball Direction: Pull vs Oppo
The next thing I looked at was how AA relates to batted ball direction: pull rate vs. opposite field rate.
- Oppo% vs. AA: -0.45 correlation (moderate negative). Lower AA’s were more likely to produce opposite-field contact.
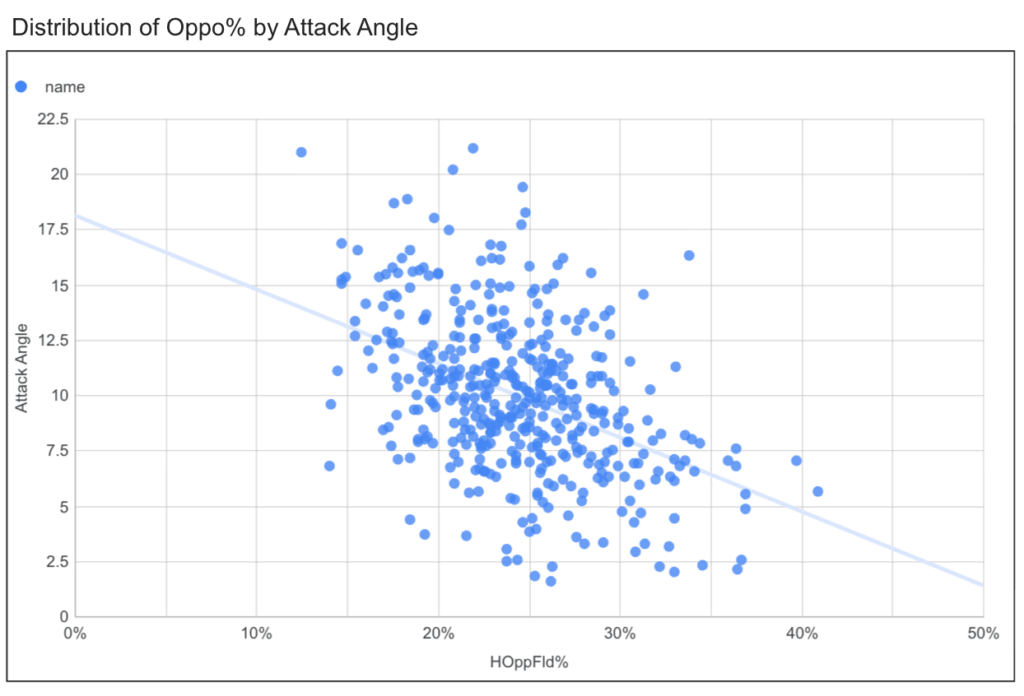
- Pull% vs. AA: 0.55 correlation (moderate positive). Higher AA’s were more likely to produce pulled balls.
This surprised me. I didn’t expect as much correlation between AA and spray angle. If we were talking Horizontal AA or Attack Direction, that would make sense, since those angles directly measure the barrel’s position at contact relative to home plate. A positive angle would be the barrel out in front of the knob, zero is perfectly parallel to the front of home plate, and negative being barrel still behind the knob at contact. But AA’s relationship to contact point adds another layer here.
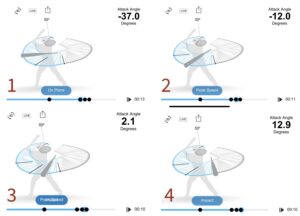
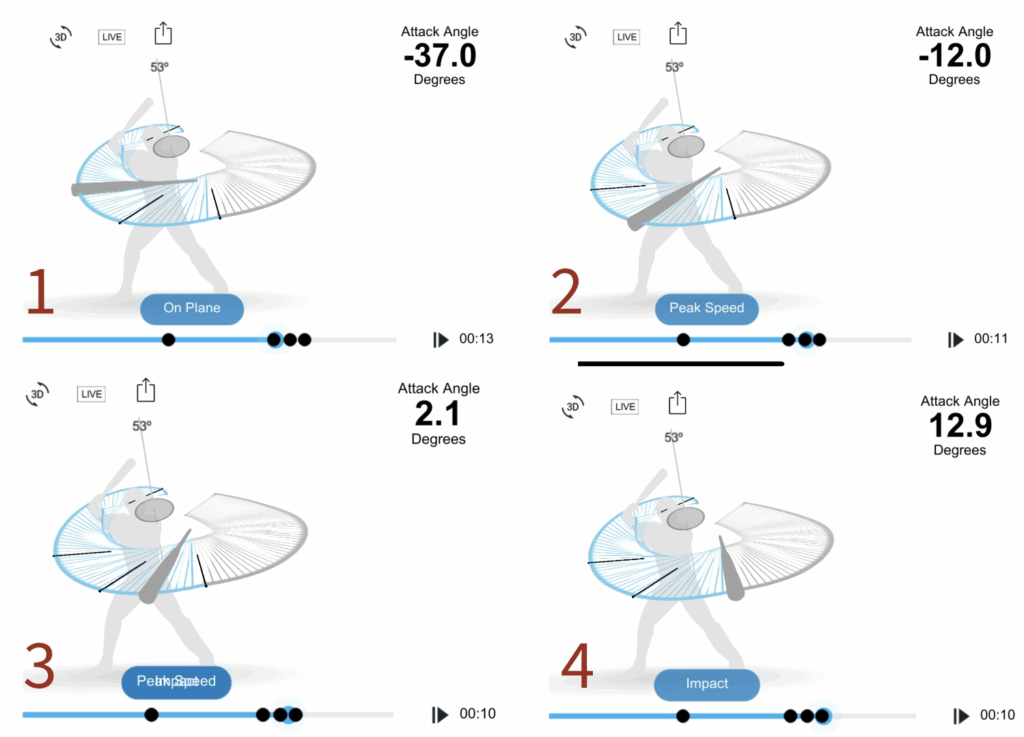
Take a look at the Blast Motion images below. Every hitter begins their swing above the ball, creating a negative AA at first. As the bat moves down into the zone, it eventually levels out, then starts working back uphill. Where a hitter makes contact along that path matters:
- Deeper contact (ball caught later): Bat still working down → flatter AA → more likely to hit the ball the other way, often with more loft.
- Out front contact (ball caught earlier): Bat already working up → higher AA → more pulled balls, often with more knuckle or topspin to the pull side.
This connects with the average MLB batted ball launch angle data from 2024:
- Pullside avg. LA: 4.7°
- Center avg. LA: 13°
- Oppo avg. LA: 28.6°
In other words: batted balls to the opposite field on average leave the bat at higher launch angles, while pull-side contact is much lower on average. This makes sense when you compare the relationship between contact point and AA.
From a coaching standpoint, I often start swing analysis by asking:
- Where does this hitter level out their path? Or at what point relative to contact does the attack angle reach zero and then start working upwards?
- How long do they stay in that quality 5°-15° AA range?
- Lower AA’s → stay level longer, leading to higher contact rates.
- Higher AA’s → leave the level zone quicker, meaning less contact but more ability to drive the ball in the air.
This is where knowing a hitter’s batted-ball profile matters. Some players thrive by pulling in the air, others by going oppo more often. Our job as hitting coaches is to decide whether a hitter needs adjustments, or if their current profile is already optimal for their strengths.
As I’ve said before: every hitter moves differently. Factors like side bend, rotational ability, ability to hinge and side bend, and grip can all influence their path. That’s why I rely on feedback tools like Blast Motion during training. They give real-time insight into how a player’s AA shifts across environments: Whether it’s BP, machine work, or live pitching. Each of those comes with different Vertical Approach Angles, which can significantly affect swing path and outcomes.
These are the kinds of questions that keep hitting coaches curious, and push us to keep blending data, movement, and production.
Back to the original question: Should a hitter swing down, up, or level?
I hope this research on Attack Angle helped shed light on that. It certainly answered some of my own questions.
Here’s what I believe: there isn’t one perfect answer. Success in this game can come from any of the three paths: down, up, or level. It depends on the hitter, their style, and their movement preferences.
When I evaluate a hitter with access to path data, I start by asking:
- Are they consistently in the 5–15° AA range?
- Do they stay there consistently, or does it fluctuate?
- What do their contact rate and batted-ball profile (launch angle/spray angle) look like when they connect?
- Do those ranges fit their skill set, or do we need to adjust their path?
To fellow coaches and hitters: I hope you found something here that helps your understanding of the swing. Attack Angle isn’t a holy grail, it’s a tool. Every hitter is a unique mover, and our job is to optimize their production within their own movement capabilities.
Happy hitting!